

|
v2.0.0
|
Loading...
Searching...
No Matches
|
|
v2.0.0
|
Sparse morph operator that re-samples an INVLIB::InvSourceEstimate from one subject's source space onto another. More...
#include "../inv_global.h"#include "../inv_source_estimate.h"#include <Eigen/Core>#include <Eigen/Sparse>#include <QString>#include <QList>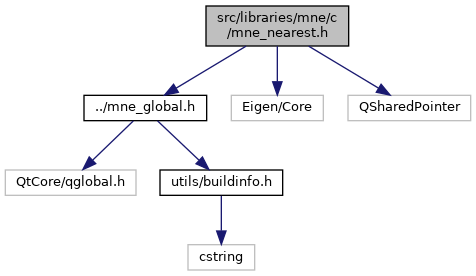
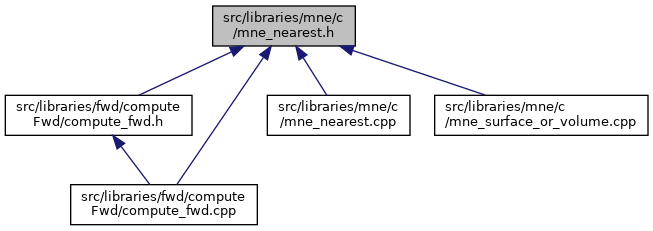
Go to the source code of this file.
Classes | |
| class | INVLIB::SourceMorph |
| Morphs source estimates from one subject's source space to another. More... | |
Namespaces | |
| namespace | INVLIB |
| Inverse source estimation (MNE, dSPM, sLORETA, dipole fitting). | |
Sparse morph operator that re-samples an INVLIB::InvSourceEstimate from one subject's source space onto another.
SPDX-License-Identifier: BSD-3-Clause Copyright (c) 2026 MNE-CPP Authors
INVLIB::SourceMorph is the C++ peer of mne-python's mne.compute_source_morph + SourceMorph.apply. It consumes the sparse vertex-to-vertex interpolation matrix produced by MNELIB::MNEMorphMap (barycentric weights on the registered sphere) and stores it together with the from/to vertex lists so a precomputed morph can be re-applied to many source estimates from the same subject pair without re-doing the surface interpolation. The resulting morphed estimate carries the to subject's vertex list and time axis untouched, making it directly comparable to estimates that were inverse-solved natively on the target subject.
Definition in file source_morph.h.
 1.16.1