MNE Tracer
It is very hard to improve what you cannot measure.
During development it is common to have to decide between two (or more) different but equivalent implementations. We value improving code maintainability and coherence on top of achieving efficient implementations. But it is not uncommon to find situations where two solutions seem equally valid. Being able to understand the performance implications of each option helps make informed decisions and learn through the process. MNE Tracer was designed for exactly these situations — it is a code tracing tool that records when specified methods are executed.
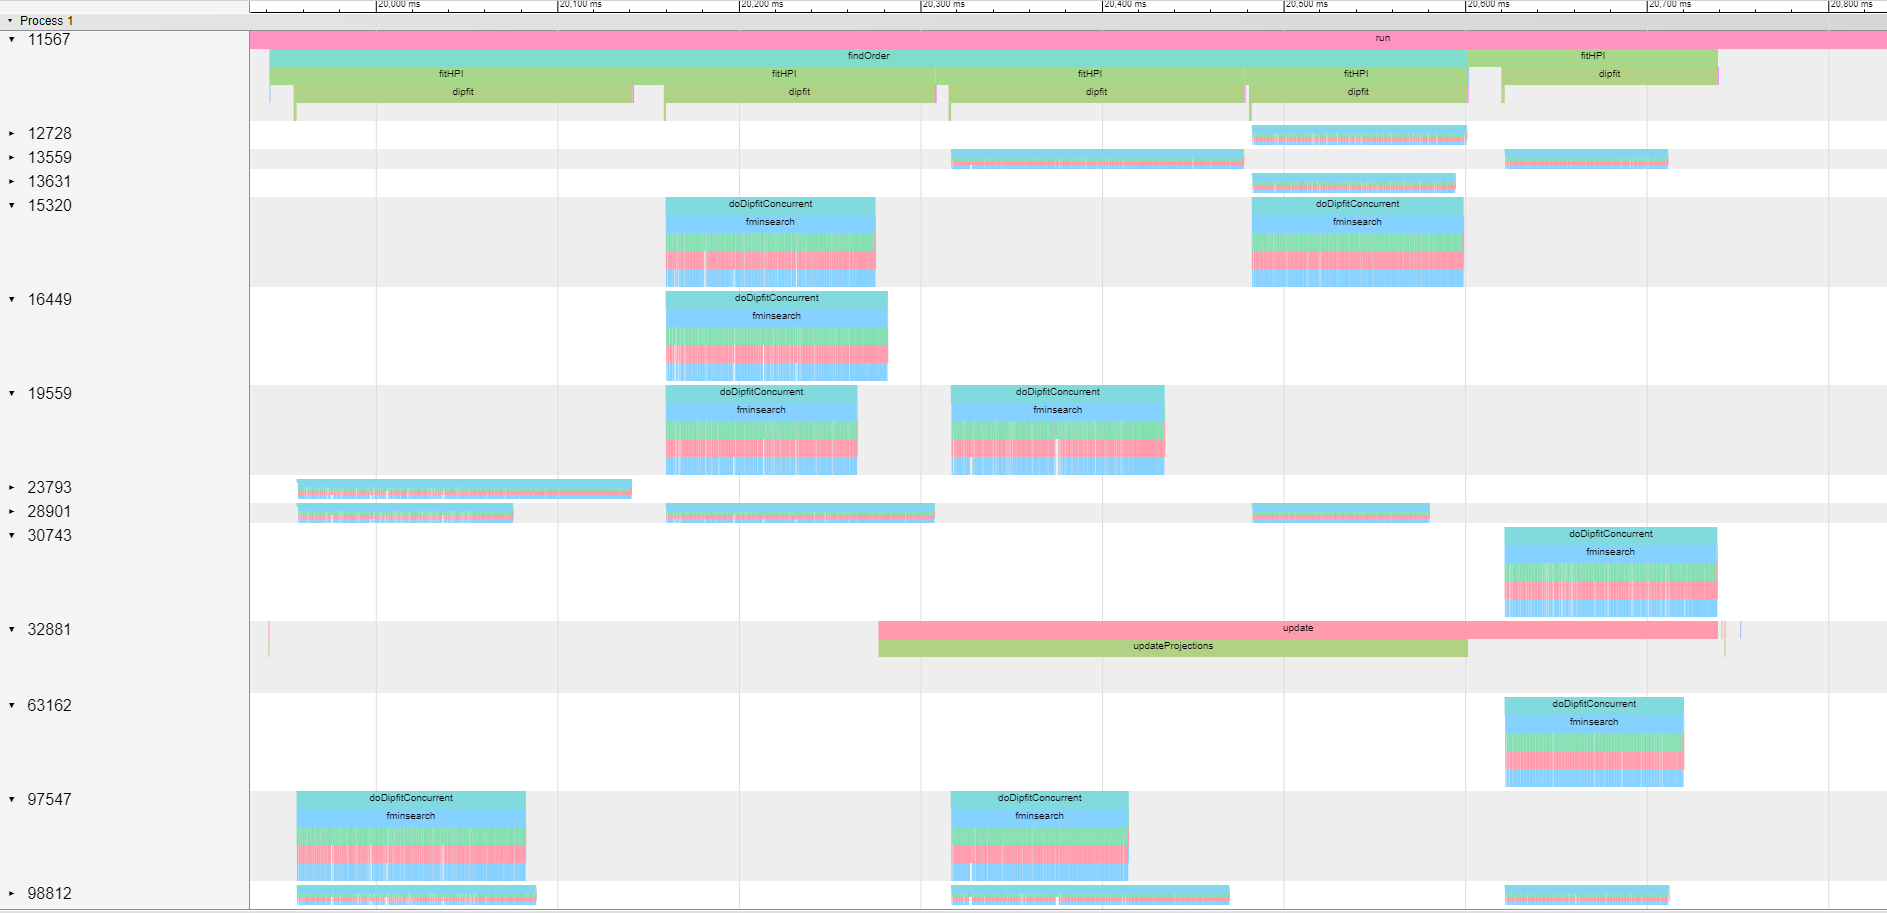
MNE Tracer writes a JSON file where each traced function call is recorded as an event. The format is compatible with Google Chrome’s built-in tracer (chrome://tracing) and with QtCreator’s tracer plugin. To visualize your trace, open Chrome, navigate to chrome://tracing, and load the generated JSON file.
Adding MNE Tracer to Your Code
There are three steps to integrate MNE Tracer:
-
Link the Utils library. The tracing functionality lives in the Utils library (
src/libraries/utils). If you are using the standard MNE-CPP build setup, Utils is linked by default. Verify that it is listed in your target’sCMakeLists.txt. -
Define the
TRACEmacro. You can do this by passing-DTRACE=ONto CMake or by adding#define TRACEbefore including the MNE Tracer header:
cmake -B build -S . -DTRACE=ON
- Include the header. Add
#include <utils/mnetracer.h>to the files you want to trace. A convenient approach is to include it in your project’s*_global.hheader, which is typically included by every source file in the project.
With the Utils library linked, the TRACE macro defined, and the header included, MNE Tracer is ready to use.
Using MNE Tracer
Enabling and Disabling the Tracer
Before recording any function calls, initialize the tracer output file with MNE_TRACER_ENABLE(filename.json). The file name can describe the particular test you are running. The file is saved in the same directory as your application binary.
After this call, every function marked as traceable will be recorded. When you are done tracing, close and finalize the output file with MNE_TRACER_DISABLE. No tracing occurs after this point.
For example, in an application’s main() function:
int main(int argc, char *argv[])
{
    MNE_TRACER_ENABLE(filename.json)

    //... your application starts here
    //... you can trace specific function calls
    //... at this point by adding the
    //... macro MNE_TRACE() to your code.

    MNE_TRACER_DISABLE

    return returnValue;
}
Specifying Which Functions to Trace
In a typical C++ application, many generic function calls occur to execute a specific piece of code. To focus on only the functions you care about, add the MNE_TRACE() macro as the first line after the opening brace of each function you want to trace:
void ImportantClass::importantMethod(int a)
{
    MNE_TRACE()
    //...the method continues here
    //...
}
Automatically Tracing All Methods in a Class
If you want to trace every method in a class without manually adding MNE_TRACE() to each one, use the provided Python helper script at tools/mnetracer.py:
- Add the
MNE_TRACE()macro to every method:
python tools/mnetracer.py file=<yourfile.cpp> mode=add
- Remove only the automatically added macros (manually placed
MNE_TRACE()calls are preserved):
python tools/mnetracer.py file=<yourfile.cpp> mode=delete
- Remove all
MNE_TRACE()occurrences, including manually placed ones:
python tools/mnetracer.py file=<yourfile.cpp> mode=deleteAll