

|
v2.0.0
|
Loading...
Searching...
No Matches
|
|
v2.0.0
|
BEM model implementation — FIFF I/O for layered surfaces and pre-inverted potential-solution matrices, IP-approach setup, and the dipole-field/potential evaluators that drive the BEM forward solver. More...
#include "fwd_bem_model.h"#include "fwd_bem_solution.h"#include "fwd_eeg_sphere_model.h"#include <mne/mne_surface.h>#include <mne/mne_triangle.h>#include <mne/mne_source_space.h>#include "fwd_comp_data.h"#include <memory>#include "fwd_thread_arg.h"#include <fiff/fiff_stream.h>#include <fiff/fiff_named_matrix.h>#include <QFile>#include <QList>#include <QThread>#include <QtConcurrent>#include <QDebug>#include <math.h>#include <Eigen/Dense>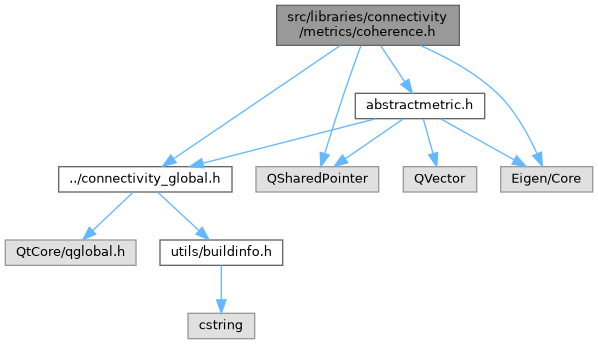
Go to the source code of this file.
Classes | |
| struct | FWDLIB::SurfExpl |
| struct | FWDLIB::MethodExpl |
| struct | FWDLIB::FrameNameRec |
| Lookup record mapping a FIFF coordinate frame integer ID to its human-readable name. More... | |
Namespaces | |
| namespace | FWDLIB |
| Forward modelling — BEM solver, spherical models, sensor/coil definitions and the lead-field assembly that links current dipoles to MEG/EEG sensor readings. | |
Macros | |
| #define | _USE_MATH_DEFINES |
Functions | |
| const QString | mne_coord_frame_name_40 (int frame) |
| double | arsinh (double x) |
BEM model implementation — FIFF I/O for layered surfaces and pre-inverted potential-solution matrices, IP-approach setup, and the dipole-field/potential evaluators that drive the BEM forward solver.
SPDX-License-Identifier: BSD-3-Clause Copyright (c) 2017-2026 MNE-CPP Authors
Definition in file fwd_bem_model.cpp.
| #define _USE_MATH_DEFINES |
Definition at line 47 of file fwd_bem_model.cpp.
|
inline |
Definition at line 1541 of file fwd_bem_model.cpp.
| const QString mne_coord_frame_name_40 | ( | int | frame | ) |
Definition at line 131 of file fwd_bem_model.cpp.
 1.16.1