

|
v2.0.0
|
Loading...
Searching...
No Matches
|
|
v2.0.0
|
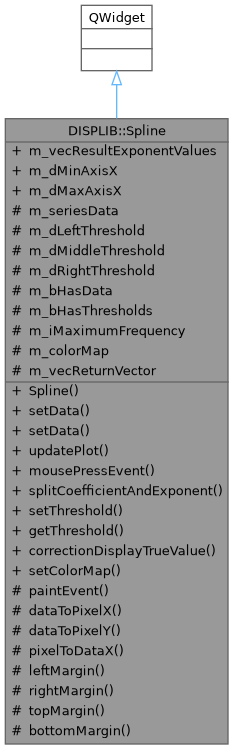
Histogram QWidget with cubic-spline overlay and interactive threshold markers. More...
#include <spline.h>
Public Types | |
| typedef QSharedPointer< Spline > | SPtr |
| typedef QSharedPointer< const Spline > | ConstSPtr |
Signals | |
| void | borderChanged (double leftThreshold, double middleThreshold, double rightThreshold) |
Public Member Functions | |
| Spline (QWidget *parent=nullptr, const QString &title="Spline Histogram") | |
| template<typename T> | |
| void | setData (const Eigen::Matrix< T, Eigen::Dynamic, 1 > &matClassLimitData, const Eigen::Matrix< int, Eigen::Dynamic, 1 > &matClassFrequencyData) |
| template<typename T> | |
| void | setData (const Eigen::Matrix< T, 1, Eigen::Dynamic > &matClassLimitData, const Eigen::Matrix< int, 1, Eigen::Dynamic > &matClassFrequencyData) |
| template<typename T> | |
| void | updatePlot (const Eigen::Matrix< T, Eigen::Dynamic, Eigen::Dynamic > &matClassLimitData, const Eigen::VectorXi &matClassFrequencyData) |
| void | mousePressEvent (QMouseEvent *event) override |
| template<typename T> | |
| void | splitCoefficientAndExponent (const Eigen::Matrix< T, Eigen::Dynamic, Eigen::Dynamic > &matClassLimitData, int iClassAmount, Eigen::VectorXd &vecCoefficientResults, Eigen::VectorXi &vecExponentValues) |
| void | setThreshold (const QVector3D &vecThresholdValues) |
| const QVector3D & | getThreshold () |
| QVector3D | correctionDisplayTrueValue (QVector3D vecOriginalValues, QString upOrDown) |
| void | setColorMap (const QString &colorMap) |
Public Attributes | |
| Eigen::VectorXi | m_vecResultExponentValues |
| double | m_dMinAxisX |
| double | m_dMaxAxisX |
Protected Member Functions | |
| void | paintEvent (QPaintEvent *event) override |
| double | dataToPixelX (double dataX) const |
| double | dataToPixelY (double dataY) const |
| double | pixelToDataX (double pixelX) const |
| int | leftMargin () const |
| int | rightMargin () const |
| int | topMargin () const |
| int | bottomMargin () const |
Protected Attributes | |
| QList< QPointF > | m_seriesData |
| double | m_dLeftThreshold |
| double | m_dMiddleThreshold |
| double | m_dRightThreshold |
| bool | m_bHasData |
| bool | m_bHasThresholds |
| int | m_iMaximumFrequency |
| QString | m_colorMap |
| QVector3D | m_vecReturnVector |
Histogram QWidget with cubic-spline overlay and interactive threshold markers.
Click-drag drops left / middle / right threshold lines that are emitted as data-space coordinates; otherwise the API mirrors Bar (setData / updatePlot templates).
| typedef QSharedPointer<const Spline> DISPLIB::Spline::ConstSPtr |
| typedef QSharedPointer<Spline> DISPLIB::Spline::SPtr |
| Spline::Spline | ( | QWidget * | parent = nullptr, |
| const QString & | title = "Spline Histogram" ) |
The constructor for Spline
| [in] | parent | sets the behaviour of Spline as an object, defaults to no parent QWidget. |
| [in] | title | string to specify the title displayed on the histogram, defaults to "Spline Histogram". |
Definition at line 50 of file spline.cpp.
|
signal |
emit signal consisting of three threshold lines x-axis value if any one of them is changed
| [out] | leftThreshold | value of the left threshold line. |
| [out] | middleThreshold | value of the middle threshold line. |
| [out] | rightThreshold | value of the right threshold line. |
|
inlineprotected |
| QVector3D Spline::correctionDisplayTrueValue | ( | QVector3D | vecOriginalValues, |
| QString | upOrDown ) |
correctionDisplayTrueValue creates necessary adjustment of exponential multiplication with base 10
| [in] | vecOriginalValues | QVector3D consisting of 3 original values. |
| [in] | upOrDown | Choice between "up" or "down" conversion direction. |
Definition at line 325 of file spline.cpp.
|
protected |
Converts data X coordinate to pixel X coordinate.
Definition at line 69 of file spline.cpp.
|
protected |
Converts data Y coordinate to pixel Y coordinate.
Definition at line 79 of file spline.cpp.
| const QVector3D & Spline::getThreshold | ( | ) |
getThreshold retrieves the current threshold values
Definition at line 313 of file spline.cpp.
|
inlineprotected |
|
override |
constructor for mouse press event behaviour to create threshold lines and signal emit
| [in] | event | mouse press input. |
Definition at line 230 of file spline.cpp.
|
overrideprotected |
Paints the spline chart.
| [in] | event | The paint event. |
Definition at line 98 of file spline.cpp.
|
protected |
Converts pixel X coordinate to data X coordinate.
Definition at line 88 of file spline.cpp.
|
inlineprotected |
| void Spline::setColorMap | ( | const QString & | colorMap | ) |
setColorMap sets the color mapping on the histogram background
| [in] | colorMap | qstring of the color gradient from user input. |
Definition at line 305 of file spline.cpp.
| void DISPLIB::Spline::setData | ( | const Eigen::Matrix< T, 1, Eigen::Dynamic > & | matClassLimitData, |
| const Eigen::Matrix< int, 1, Eigen::Dynamic > & | matClassFrequencyData ) |
| void DISPLIB::Spline::setData | ( | const Eigen::Matrix< T, Eigen::Dynamic, 1 > & | matClassLimitData, |
| const Eigen::Matrix< int, Eigen::Dynamic, 1 > & | matClassFrequencyData ) |
| void Spline::setThreshold | ( | const QVector3D & | vecThresholdValues | ) |
setThreshold takes in QVector3D value and creates the corresponding lines in the histogram
| [in] | vecThresholdValues | QVector3D consisting of 3 values corresponding to the threshold lines. |
Definition at line 271 of file spline.cpp.
| void DISPLIB::Spline::splitCoefficientAndExponent | ( | const Eigen::Matrix< T, Eigen::Dynamic, Eigen::Dynamic > & | matClassLimitData, |
| int | iClassAmount, | ||
| Eigen::VectorXd & | vecCoefficientResults, | ||
| Eigen::VectorXi & | vecExponentValues ) |
splitCoefficientAndExponent takes in QVector value of coefficient and exponent and normalizes them.
| [in] | matClassLimitData | vector input filled with values of class limits. |
| [in] | iClassAmount | amount of classes in the histogram. |
| [out] | vecCoefficientResults | vector filled with values of coefficient only. |
| [out] | vecExponentValues | vector filled with values of exponent only. |
|
inlineprotected |
| void DISPLIB::Spline::updatePlot | ( | const Eigen::Matrix< T, Eigen::Dynamic, Eigen::Dynamic > & | matClassLimitData, |
| const Eigen::VectorXi & | matClassFrequencyData ) |
|
protected |
|
protected |
|
protected |
|
protected |
| double DISPLIB::Spline::m_dMaxAxisX |
|
protected |
| double DISPLIB::Spline::m_dMinAxisX |
|
protected |
|
protected |
|
protected |
| Eigen::VectorXi DISPLIB::Spline::m_vecResultExponentValues |
|
protected |
 1.16.1