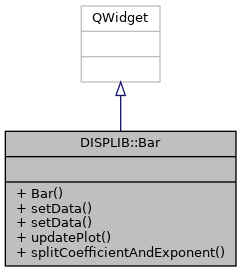
Bar class for histogram display using QtCharts.
More...
#include <bar.h>
|
| | Bar (const QString &title="", QWidget *parent=0) |
| |
| template<typename T > |
| void | setData (const Eigen::Matrix< T, Eigen::Dynamic, 1 > &matClassLimitData, const Eigen::Matrix< int, Eigen::Dynamic, 1 > &matClassFrequencyData, int iPrecisionValue) |
| |
| template<typename T > |
| void | setData (const Eigen::Matrix< T, 1, Eigen::Dynamic > &matClassLimitData, const Eigen::Matrix< int, 1, Eigen::Dynamic > &matClassFrequencyData, int iPrecisionValue) |
| |
| template<typename T > |
| void | updatePlot (const Eigen::Matrix< T, Eigen::Dynamic, Eigen::Dynamic > &matClassLimitData, const Eigen::Matrix< int, Eigen::Dynamic, Eigen::Dynamic > &matClassFrequencyData, int iPrecisionValue) |
| |
| template<typename T > |
| void | splitCoefficientAndExponent (const Eigen::Matrix< T, Eigen::Dynamic, Eigen::Dynamic > &matClassLimitData, int iClassAmount, Eigen::VectorXd &vecCoefficientResults, Eigen::VectorXi &vecExponentValues) |
| |
Bar class for histogram display using QtCharts.
Histogram display using Qtcharts, similar to matlab bar graph
Definition at line 82 of file bar.h.
◆ ConstSPtr
Const shared pointer type for Bar class.
Definition at line 88 of file bar.h.
◆ SPtr
Shared pointer type for Bar class.
Definition at line 87 of file bar.h.
◆ Bar()
| Bar::Bar |
( |
const QString & |
title = "", |
|
|
QWidget * |
parent = 0 |
|
) |
| |
The constructor for Bar.
Definition at line 66 of file bar.cpp.
◆ setData() [1/2]
template<typename T >
| void DISPLIB::Bar::setData |
( |
const Eigen::Matrix< T, 1, Eigen::Dynamic > & |
matClassLimitData, |
|
|
const Eigen::Matrix< int, 1, Eigen::Dynamic > & |
matClassFrequencyData, |
|
|
int |
iPrecisionValue |
|
) |
| |
◆ setData() [2/2]
template<typename T >
| void DISPLIB::Bar::setData |
( |
const Eigen::Matrix< T, Eigen::Dynamic, 1 > & |
matClassLimitData, |
|
|
const Eigen::Matrix< int, Eigen::Dynamic, 1 > & |
matClassFrequencyData, |
|
|
int |
iPrecisionValue |
|
) |
| |
Sets new data to the bar chart using QtCharts
- Parameters
-
| [in] | matClassLimitData | vector input filled with class limits. |
| [in] | matClassFrequencyData | vector input filled with class frequency to the corresponding class. |
| [in] | iPrecisionValue | user input to determine the amount of digits of coefficient shown in the histogram. |
Definition at line 159 of file bar.h.
◆ splitCoefficientAndExponent()
template<typename T >
| void DISPLIB::Bar::splitCoefficientAndExponent |
( |
const Eigen::Matrix< T, Eigen::Dynamic, Eigen::Dynamic > & |
matClassLimitData, |
|
|
int |
iClassAmount, |
|
|
Eigen::VectorXd & |
vecCoefficientResults, |
|
|
Eigen::VectorXi & |
vecExponentValues |
|
) |
| |
splitCoefficientAndExponent takes in QVector value of coefficient and exponent (example: 1.2e-10) and finds the coefficient (1.2) and the appropriate exponent (-12), normalize the exponents to either the lowest or highest exponent in the list then places the values in two separate QVectors
- Parameters
-
| [in] | matClassLimitData | vector input filled with values of class limits (in coefficient and exponent form). |
| [in] | iClassCount | user input to determine the amount of classes in the histogram. |
| [out] | vecCoefficientResults | vector filled with values of coefficient only. |
| [out] | vecExponentResults | vector filled with values of exponent only. |
Definition at line 228 of file bar.h.
◆ updatePlot()
template<typename T >
| void DISPLIB::Bar::updatePlot |
( |
const Eigen::Matrix< T, Eigen::Dynamic, Eigen::Dynamic > & |
matClassLimitData, |
|
|
const Eigen::Matrix< int, Eigen::Dynamic, Eigen::Dynamic > & |
matClassFrequencyData, |
|
|
int |
iPrecisionValue |
|
) |
| |
Updates the bar plot with the new data
- Parameters
-
| [in] | matClassLimitData | vector input filled with class limits. |
| [in] | matClassFrequencyData | vector input filled with class frequency to the corresponding class. |
| [in] | iPrecisionValue | user input to determine the amount of digits of coefficient shown in the histogram. |
Definition at line 183 of file bar.h.
The documentation for this class was generated from the following files:
- src/libraries/disp/plots/bar.h
- src/libraries/disp/plots/bar.cpp
