
|
v2.0.0
|
Loading...
Searching...
No Matches
|
|
v2.0.0
|
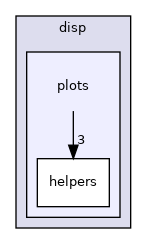
Directories | |
| helpers | |
Files | |
| bar.cpp | |
| Implementation of the Bar histogram widget (axis layout and bar drawing). | |
| bar.h | |
| QPainter-based bar / histogram widget for Eigen class-limit + frequency vectors. | |
| graph.cpp | |
| Implementation of the Graph base widget (label storage, resize handling, label drawing). | |
| graph.h | |
| Abstract base widget providing title, axis labels and resize handling for the in-house 2-D plots. | |
| imagesc.cpp | |
| Implementation of the ImageSc heat-map widget (matrix-to-image colour mapping and painting). | |
| imagesc.h | |
| MATLAB-style false-colour heat-map widget for Eigen matrices. | |
| lineplot.cpp | |
| Implementation of the LinePlot widget (auto-range computation and polyline painting). | |
| lineplot.h | |
| Simple x/y line-series widget drawn with QPainter. | |
| plot.cpp | |
| Implementation of the Plot vector-plot widget (auto-range and polyline painting). | |
| plot.h | |
| MATLAB-style line plot for an Eigen vector, built on DISPLIB::Graph. | |
| spline.cpp | |
| Implementation of the Spline histogram widget (spline interpolation, threshold markers, click signals). | |
| spline.h | |
| Histogram widget with a cubic spline overlay and click-driven threshold markers. | |
| tfplot.cpp | |
| Implementation of the TFplot time-frequency widget (image generation from spectrogram + colour map). | |
| tfplot.h | |
| Time-frequency spectrogram widget rendering an Eigen matrix as a colour image. | |
 1.16.1